

As the financial world increasingly embraces digital currencies, grasping the fundamentals of cryptocurrency becomes essential for anyone looking to invest. A critical skill in this realm is learning how to read charts and market trends. This article will guide you through the basics, equipping you with the knowledge needed to make informed investment decisions in the exciting world of cryptocurrency.
Understanding Cryptocurrency Charts
At the heart of Cryptocurrency Basics: How to Read Charts and Market Trends lies the ability to interpret various chart types. These charts provide visual representations of price movements, trading volumes, and market trends over time. The most common types of charts include line charts, bar charts, and candlestick charts.
Line Charts
Line charts are the simplest form of cryptocurrency charts. They plot the closing prices of a cryptocurrency over a specific period, creating a continuous line. While they provide a clear view of price movements, line charts do not offer detailed information about trading volumes or intraday price fluctuations.
Bar Charts
Bar charts present more information than line charts. Each bar represents a specific time frame—like one day or one hour—and shows the opening, closing, highest, and lowest prices for that period. The vertical line of the bar indicates the price range, while the horizontal ticks represent the opening and closing prices. This chart type is particularly useful for visualizing price volatility and trends over time.
Candlestick Charts
Candlestick charts are favored among traders for their detailed representation of price movements. Each candlestick encapsulates the opening, closing, high, and low prices within a specific time frame. The body of the candlestick indicates whether the price increased (often a green or white candle) or decreased (usually a red or black candle). The wicks show the highest and lowest prices during that period. Learning to recognize candlestick patterns can significantly enhance your ability to interpret market trends.
Key Indicators in Cryptocurrency Charts
When delving into Cryptocurrency Basics: How to Read Charts and Market Trends, it’s vital to understand the key indicators that can shed light on market movements.
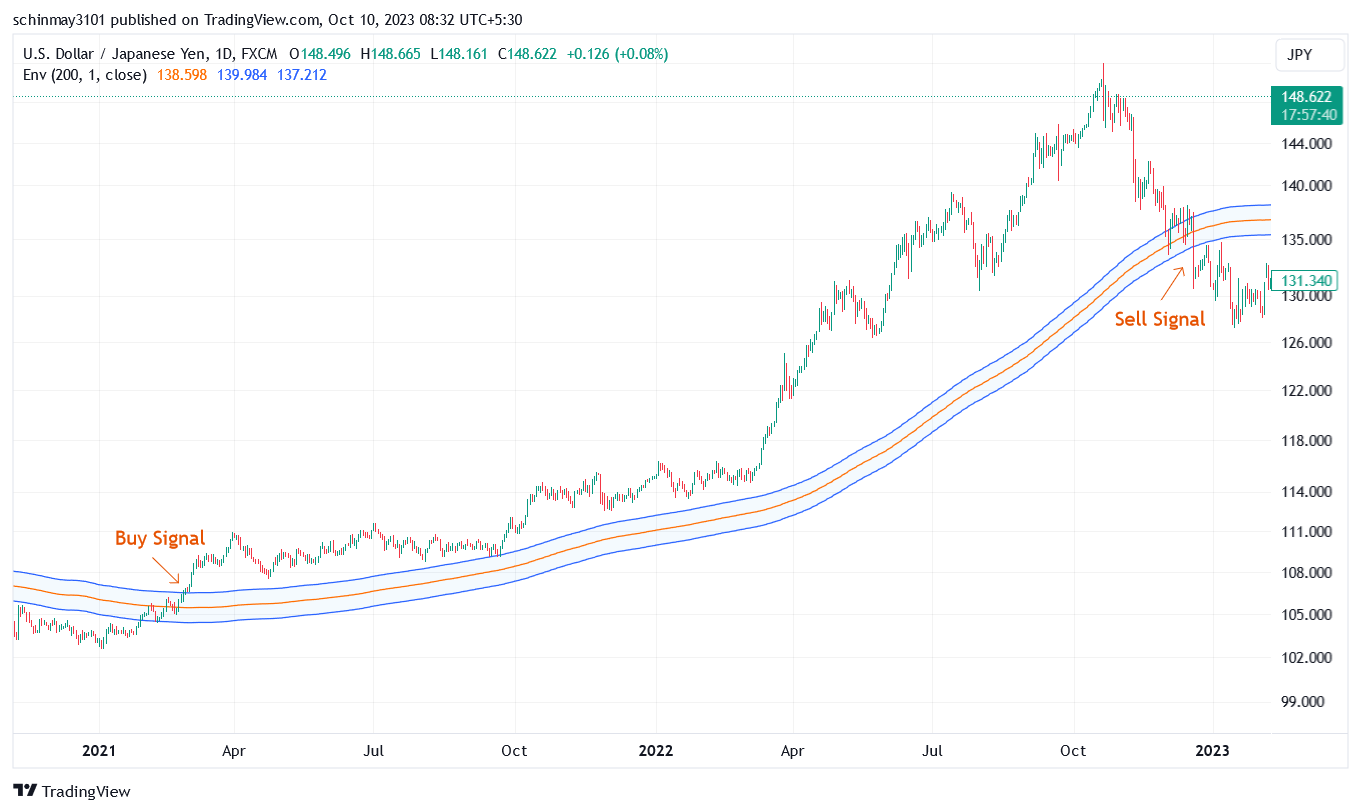
Moving Averages
Moving averages are one of the most commonly used indicators to smooth out price data over a specific period. The two main types are:
- Simple Moving Average (SMA): This calculates the average price over a set number of periods. For instance, a 50-day SMA averages the closing prices over the last 50 days. Traders often use this to identify trends—if the price is above the SMA, it may suggest an upward trend, while being below it could indicate a downward trend.
- Exponential Moving Average (EMA): This gives more weight to recent prices, making it more responsive to changes. The EMA is particularly useful for identifying short-term trends.
Relative Strength Index (RSI)
The RSI is a momentum oscillator that measures the speed and change of price movements. It ranges from 0 to 100 and is typically used to identify overbought or oversold conditions. An RSI above 70 may indicate that a cryptocurrency is overbought, while an RSI below 30 could suggest it’s oversold. This information can be crucial for making buying or selling decisions.
Volume
Trading volume is another key factor in analyzing market trends. It represents the total number of shares or contracts traded during a specific period. High trading volume often indicates strong interest in a particular cryptocurrency, leading to more significant price movements. Analyzing volume alongside price changes can help confirm trends; for example, if a cryptocurrency’s price rises on increasing volume, it may suggest a solid upward trend.
Analyzing Market Trends
Understanding market trends is a critical aspect of Cryptocurrency Basics: How to Read Charts and Market Trends. Trends can be classified as upward (bullish), downward (bearish), or sideways (consolidating).
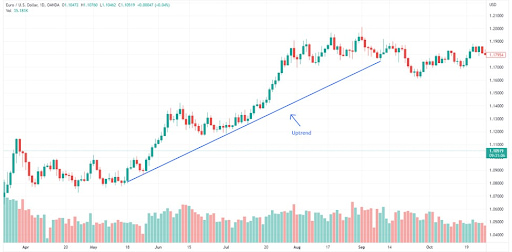
Identifying Upward Trends
In an upward trend, prices consistently make higher highs and higher lows. Traders often look for entry points during pullbacks or corrections within the trend. Monitoring overall market sentiment and significant news events can provide valuable context for these trends.
Recognizing Downward Trends
A downward trend is characterized by lower highs and lower lows. In this scenario, traders may seek short-selling opportunities. It’s essential to consider market sentiment and news that might impact prices. Often, downward trends can signal potential buying opportunities if the price reaches support levels.
Sideways Trends
Sideways trends occur when prices move within a specific range, indicating market indecision. During this phase, traders might accumulate positions or prepare for potential breakouts. Identifying support and resistance levels can help determine future price movements.
Utilizing Tools and Resources
To enhance your ability to analyze charts and market trends, various tools and resources are available. Trading platforms like Binance, Coinbase, and Kraken offer built-in charting tools with various indicators. Additionally, websites like TradingView provide advanced charting features and a community of traders sharing insights and strategies.
Online courses and tutorials can further deepen your understanding of chart reading and market analysis. Engaging with forums and communities focused on cryptocurrency can provide real-time insights and help you learn from experienced traders.
Putting It All Together
Grasping Cryptocurrency Basics: How to Read Charts and Market Trends is essential for anyone looking to succeed in the cryptocurrency market. By familiarizing yourself with different types of charts, key indicators, and market trends, you can make informed decisions about when to buy or sell digital assets.
Remember, practice makes perfect. Start by analyzing charts of cryptocurrencies you’re interested in, paying attention to patterns and indicators. Over time, you’ll develop a better intuition for market movements, helping you navigate the exciting yet volatile world of cryptocurrency with greater confidence.
In conclusion, mastering the skill of reading charts and understanding market trends is crucial for any cryptocurrency investor. With the knowledge gained from this guide, you’ll be better equipped to make informed investment decisions and harness the full potential of the digital currency landscape. Happy trading!